The global golf bag market is growing steadily at 4.85% CAGR, but the real story for B2B buyers isn’t volume — it’s the dramatic reconfiguration of sourcing economics driven by tariff escalation, sustainable material mandates, and the shift toward smaller, faster orders.
Based on our analysis of 500+ B2B sourcing inquiries received in the first half of 2026, combined with data from Mordor Intelligence, ChemAnalyst, and the Shanghai Containerized Freight Index, this report identifies the seven trends reshaping how brands, retailers, and distributors procure golf bags — and what procurement teams must do to stay competitive.

1. Market Size: $1.31 Billion and Shifting Toward Premium
The global golf bag market reached USD 1.25 billion in 2025 and is projected to hit USD 1.31 billion in 2026, advancing at a 4.85% CAGR through 2031 (Mordor Intelligence). Over the forecast period, the market is expected to reach USD 1.66 billion by 2031.
Three structural forces drive growth: golf participation diversification (new players beyond traditional on-course demographics), golf tourism expansion (multi-bag ownership for travel), and premiumization (the premium segment growing at 6.22% CAGR, faster than mass market).
Regional Market Share (2025)
| Region | Market Share | CAGR | Key Driver |
|---|---|---|---|
| North America | 47.3% | 4.2% | Brand loyalty, high discretionary spend |
| Europe | ~25% | 4.5% | Sustainability mandates, golf tourism |
| Asia-Pacific | 18.6% | 6.68% | New golf courses, rising middle class |
| Rest of World | ~9% | 5.0% | Golf tourism in Middle East, Latin America |
Source: Mordor Intelligence, 2026
Asia-Pacific is the fastest-growing region, fueled by China’s 387 new golf courses since 2015 (adding ~12.4 million players) and Japan’s 8.67 million existing golf participants.
2. The Tariff Shock: 52.6% Duty on Chinese Golf Bags
The single most consequential finding: tariff cost management has become the #1 concern for US-market B2B buyers. Chinese golf bags under HS 4202.92.31 face cumulative US effective duty of up to 52.6%: 17.6% MFN base + 25% Section 301 + 10% Section 122 surcharge.
The July 2026 Section 301 escalation adds a further 12.5% on Chinese-origin goods (CZL International Express).
Effective US Tariff Rates by Origin (2026)
| Origin | Base MFN | Section 301 | Section 122 | Total Effective |
|---|---|---|---|---|
| China | 17.6% | 25% | 10% | 52.6% |
| Vietnam | ~10% | — | ~10% | ~10% |
| Taiwan | ~10% | — | ~10% | ~10% |
| Mexico (USMCA) | 0% | — | — | 0% |
Sources: Vela Green Sports, Keep Perfect Golf
In our inquiry data, 34% of US-based buyers now explicitly ask about multi-origin sourcing options — up from fewer than 5% in 2023. The optimal 2026 strategy is diversification: retain China for complex designs and non-US markets; add Vietnam or Taiwan for tariff-sensitive US-market lines.
3. Material Shift: RPET Goes Mainstream, Nylon Holds Strong
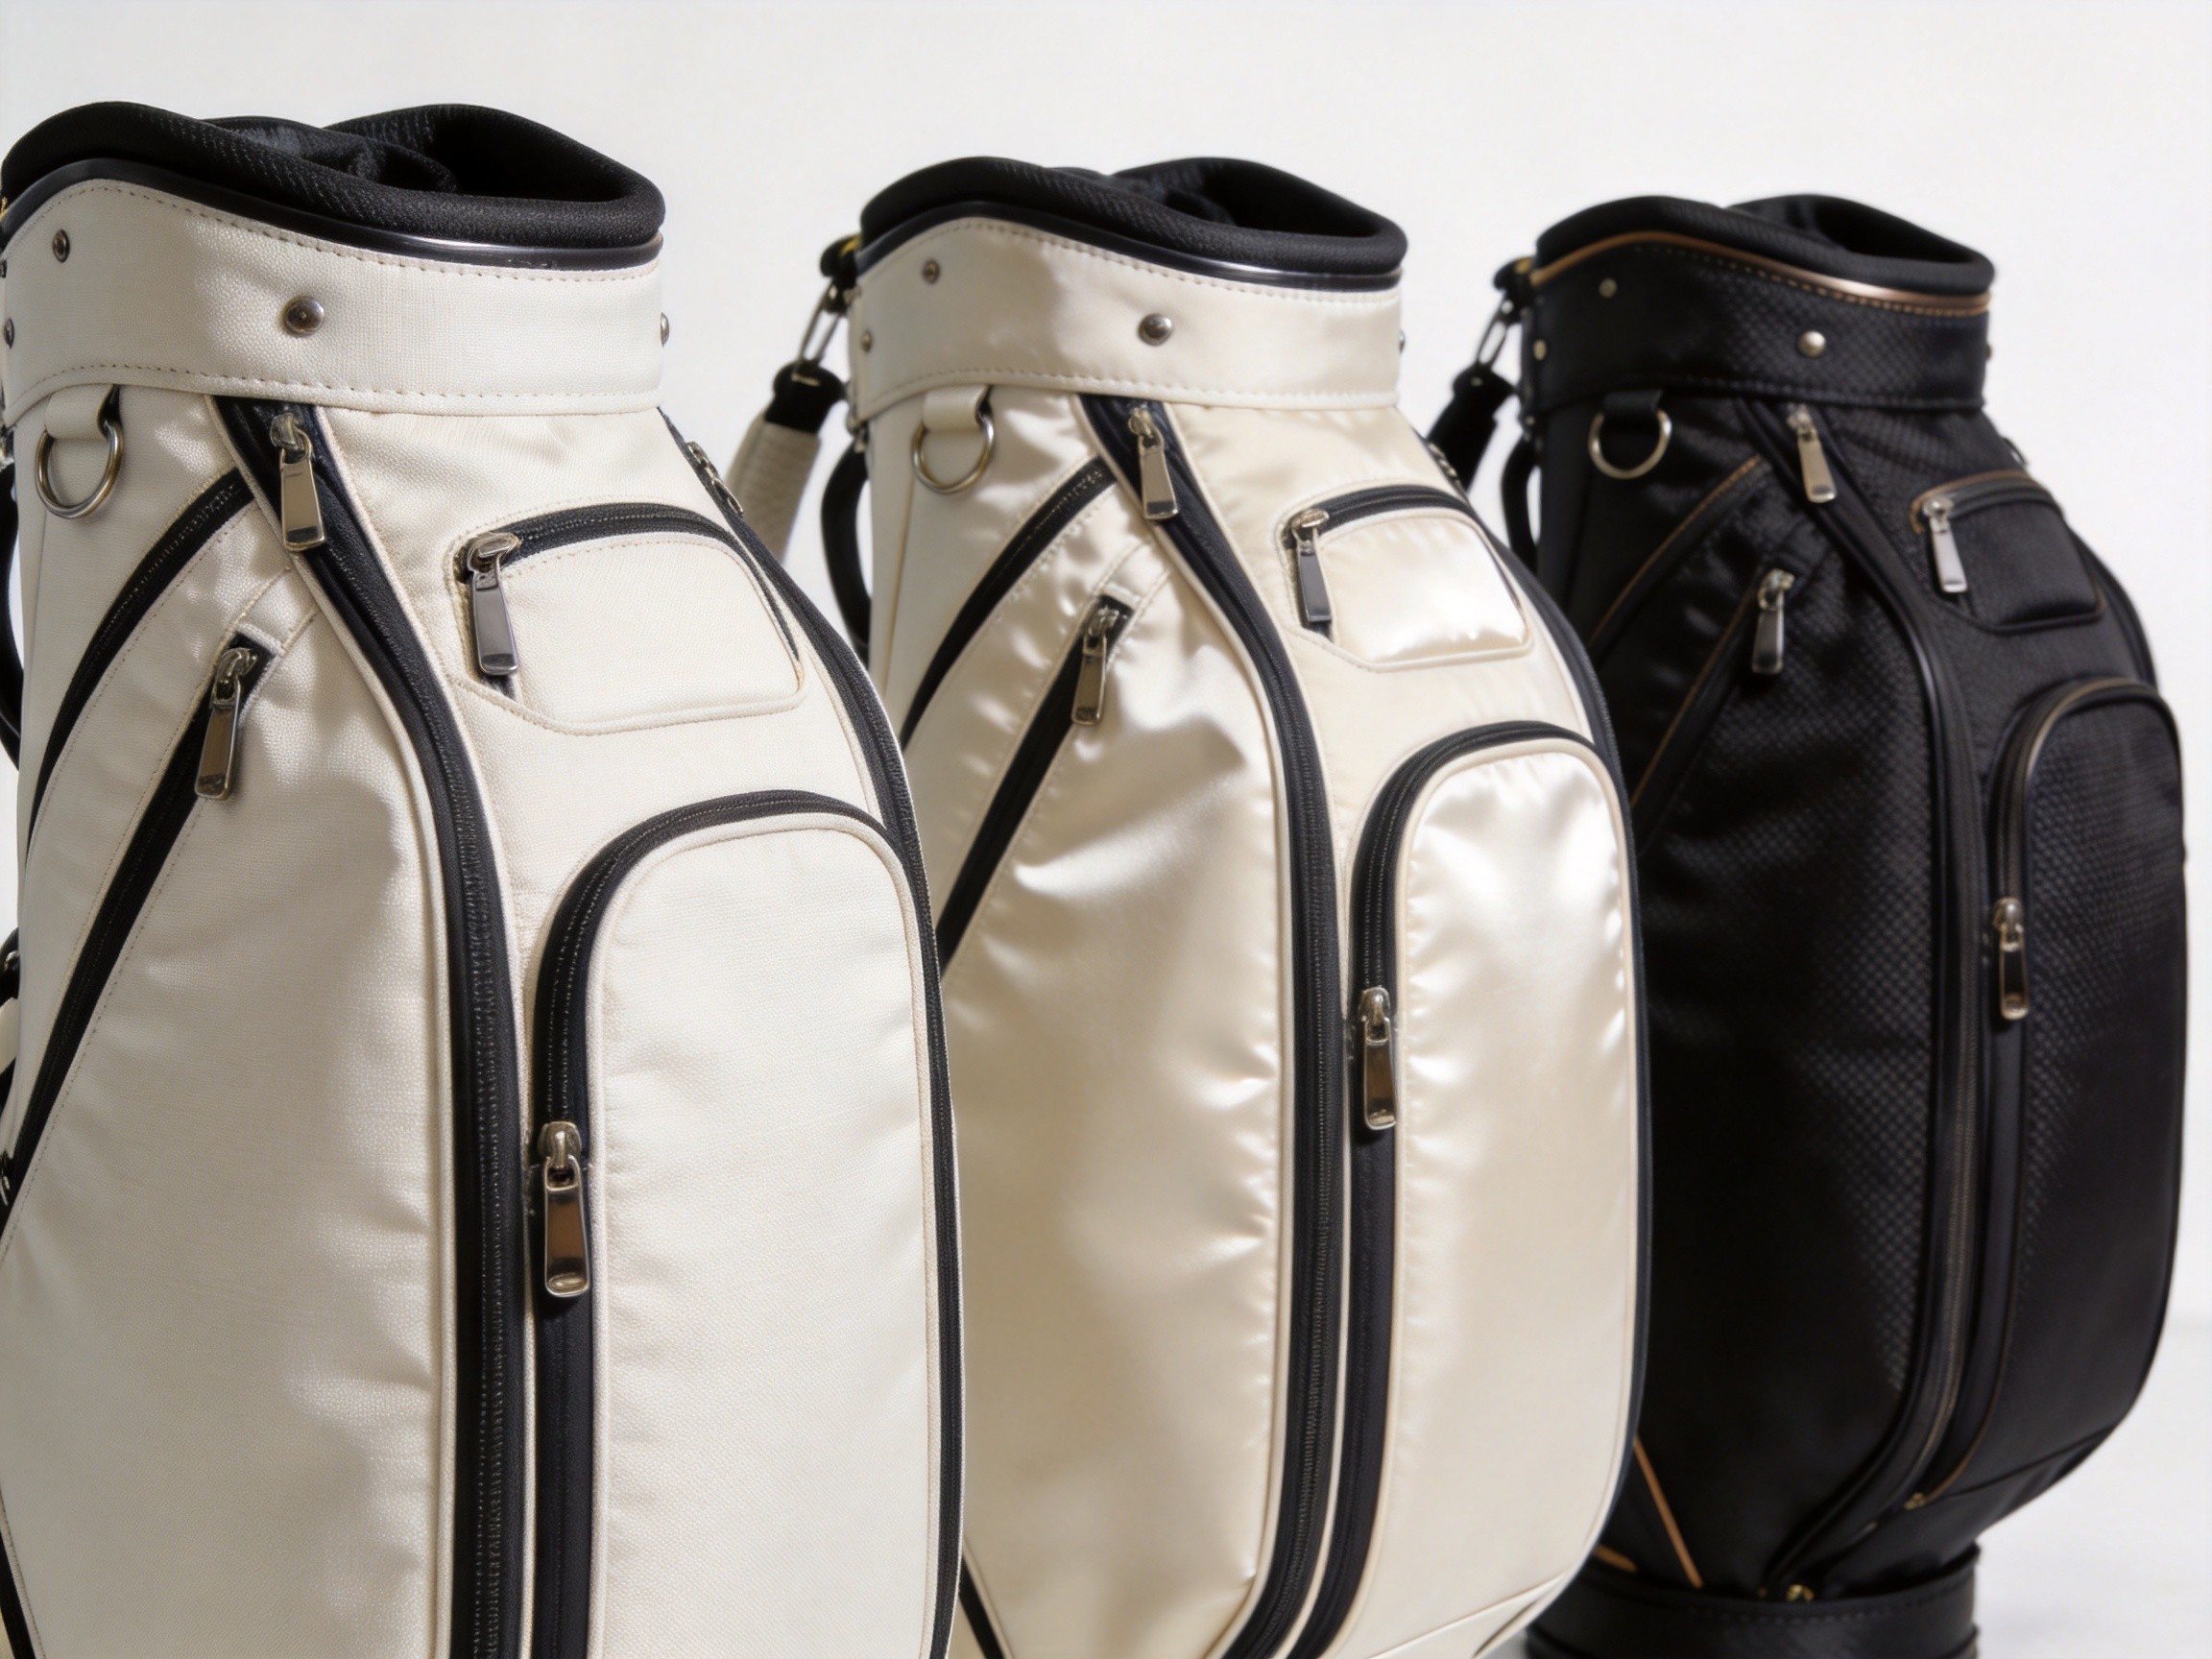
Nylon retains its structural lead with 47.53% material share in 2025 (Mordor Intelligence). Polyester is growing fastest at 6.01% CAGR, driven by cost competitiveness and rPET compatibility.
Recycled Polyester Adoption Timeline
| Year | RPET Adoption | Key Catalyst |
|---|---|---|
| 2020 | 12% | Early adopter brands |
| 2023 | 34% | EU REACH + consumer demand |
| 2025 | ~28% | GRS certification prerequisite |
| 2026 | est. 38–42% | Major European retail requirements |
Sources: China Circular Economy Association
GRS-certified recycled material supply chains are becoming a market-entry requirement. Switching to certified recycled fabrics can reduce a bag’s carbon footprint by up to 85% (Vela Green Sports).
4. Product Types: Stand Bags Lead, Cart Bags Accelerate
Stand bags held 39.72% market share in 2025 (Mordor Intelligence). Cart bags are the fastest-growing segment at 5.91% CAGR.
Product Type Performance (2025–2031)
| Product Type | 2025 Share | CAGR | Growth Driver |
|---|---|---|---|
| Stand Bags | 39.72% | ~5.2% | Walking golf resurgence, ultralight innovation |
| Cart Bags | ~35% | 5.91% | Aging demographics, push-cart adoption |
| Staff/Tour Bags | 10–15% | ~3.5% | Tour branding, corporate programs |
| Travel Bags | ~10% | ~6.0% | Golf tourism, multi-bag ownership |
| Women’s Bags | ~5% | ~7.0% | 20% participation growth, underserved market |
5. Sourcing Behavior: Smaller Batches, Faster Turnaround
78% of custom inquiries fail due to MOQ mismatch. The industry converges on three tiers: Stock (1–50 pcs), Flexible (50–100 pcs), and Deep Custom (100–500+ pcs).
MOQ Tiers for Custom Golf Bags
| Tier | Range | Best For |
|---|---|---|
| Stock / Light Custom | 1–50 pcs | First-time buyers, promo orders |
| Flexible / Semi-Custom | 50–100 pcs | Growing brands, seasonal testing |
| Deep Custom / OEM | 100–500+ pcs | Established brands, long-term programs |
60% of B2B buyers struggle with slow-moving stock (Vela Green Sports). Smaller, more frequent orders with phased delivery are replacing the bulk-order model.
6. Raw Material Costs: Nylon Feedstock Surges 22–32%

Caprolactam (Nylon 6 feedstock) surged in Q2 2026 (ChemAnalyst): North America +32.25%, Europe +30.32%, Asia-Pacific +22.08%. Polyester filament yarn also rose 15–16% across all regions.
FOB Price Benchmarks (Travel Bags, 2026)
| Tier | Materials | FOB Price | MOQ |
|---|---|---|---|
| Economy | 420D polyester | $18–$35 | ~200 units |
| Standard | 600D polyester / nylon | $30–$55 | ~150 units |
| Premium | High-tenacity nylon / TPU | $55–$120+ | 100–200 units |
| Custom | Per-spec OEM | Spec-dependent | Negotiable |
Source: golfbagmfg.com
7. Smart Features: Mainstream Charging, Early-Stage Sensors
Mainstream (61% penetration): USB-C charging, GPS pockets, solar-assist strips are now standard in premium lines. Early stage (<9%): RFID club tracking, weight sensors, NFC. Smart modules add $12–$17 to BOM vs. consumer willingness of $7–$11.
What This Means for Your Sourcing Strategy
- Diversify sourcing geography — the 40+ point tariff gap demands a dual-source strategy.
- Build sustainable material capability — GRS-certified RPET is becoming a market-entry requirement.
- Shift to flexible MOQ + phased delivery — smaller test orders with reorder triggers.
- Lock in raw material pricing — nylon feedstock up 22–32%, negotiate fixed contracts.
- Invest in compliance documentation — REACH, Prop 65, GRS, ISO 9001 unlock higher-value retail.
- Deploy smart features selectively — basic tech is table stakes; advanced sensors for limited editions.
At Keep Perfect Golf, we process 500+ B2B inquiries annually across 100+ countries. With 200+ brand clients, FOB Xiamen shipping, and MOQ 100 pieces, we help brands navigate tariff complexity, sustainable material requirements, and the shift toward flexible production. Contact our team to discuss your 2026 sourcing strategy.
Quick Answer: What are the key golf bag sourcing trends in 2026?
Based on 500+ B2B inquiries and market research: (1) Global market reached $1.31B at 4.85% CAGR; (2) US tariffs on Chinese bags hit 52.6%, creating 40+ point gap vs. Vietnam at ~10%; (3) RPET adoption surged to 38-42%, becoming European market-entry requirement; (4) Stand bags hold 39.72% share, cart bags grow fastest at 5.91% CAGR; (5) MOQ shifting to flexible 50-100 unit tiers; (6) Nylon feedstock costs up 22-32% in Q2 2026; (7) Smart features like USB-C reached 61% penetration in premium bags.
Related Products
Explore our manufacturing capabilities in this category:
 Premium Stand Bag
 Ultra-Light Stand Bag
 Hybrid Stand Bag
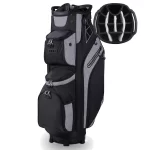 Rain-Resistant Stand Bag
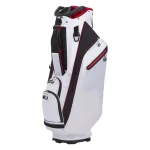 Premium Tour Cart Bag
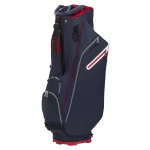 Lightweight Cart Bag
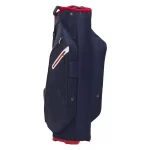 Waterproof Cart Bag
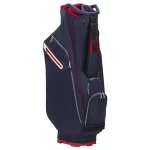 Staff Cart Bag
Need custom golf bags? Contact us for OEM/ODM quotes — MOQ 100pcs, FOB Xiamen.